How Solar Assets Generate Returns: 5 Essential Mechanics
How Does a Solar Asset Generate Returns for Equity Investors?
How does a solar asset generate returns for equity investors? At its core, a solar installation generates returns through a combination of contracted electricity revenues, long-term capital appreciation, and predictable operating cashflows that compound over the asset’s useful life – typically 25 to 30 years. Equity investors in solar infrastructure benefit from a layered return profile: contracted power purchase agreements (PPAs) deliver stable income, while declining technology costs and rising electricity prices can increase margins over time. Unlike many alternative asset classes, solar assets produce revenue from the first day of operation, with minimal variable costs and no fuel input risk. This makes solar infrastructure – particularly when structured as aggregated portfolios – one of the most predictable sources of yield available in European energy markets today. Understanding how a solar asset generates returns for equity investors requires examining both the revenue mechanics and the structural factors that separate project-level risk from portfolio-grade infrastructure.
How a Solar Asset Generates Returns for Equity Investors Through Revenue Mechanics
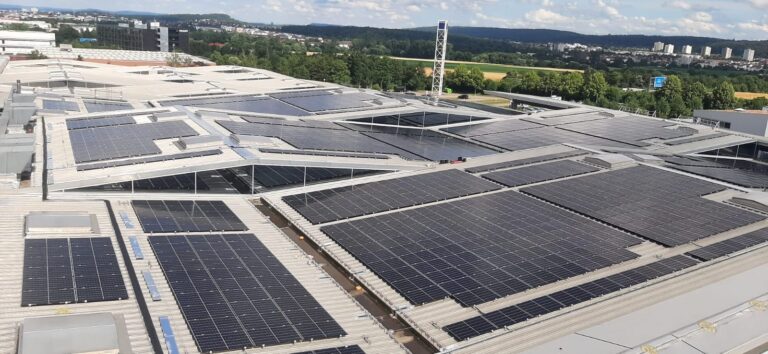
The primary revenue stream of any solar asset is the sale of electricity. In distributed rooftop configurations, this revenue typically flows through one of two channels: a long-term PPA with the building occupant, or net metering and feed-in arrangements with the local grid. Long-duration PPAs – often structured over 10 to 20 years – provide contracted pricing that underpins investor cashflow models. According to SolarPower Europe, the EU installed approximately 56 GW of new solar capacity in 2023 alone, with distributed systems on commercial and industrial buildings representing a growing share. This expansion reflects increasing demand from SMEs seeking energy cost stability, which in turn strengthens the counterparty landscape for PPA-backed equity investments.
Beyond contracted revenue, solar assets generate returns through avoided cost savings passed to offtakers, which supports contract renewal and portfolio retention. Operating expenses remain low relative to other infrastructure classes. Solar systems have no moving parts in the core generation unit, require minimal maintenance, and benefit from manufacturer warranties that often extend 20 years or more. The result is a high operating margin asset with long-duration visibility – precisely the characteristics that equity investors in infrastructure seek. Across distributed rooftop solar infrastructure in Europe, these fundamentals are now well established.
Structural Factors That Determine How Solar Assets Generate Returns for Equity Investors
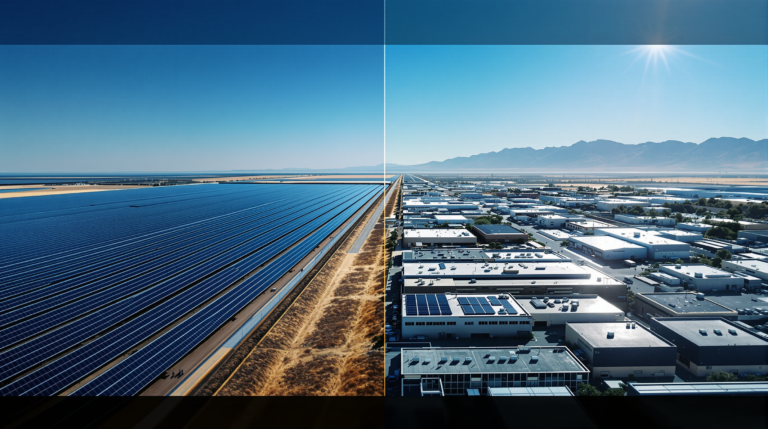
Not all solar assets deliver returns equally. The structural difference between a standalone rooftop installation and a managed portfolio of aggregated assets is significant from an equity perspective. A single site carries concentration risk – one counterparty, one jurisdiction, one regulatory environment. An aggregated portfolio diversifies across geographies, offtakers, and contract maturities, which materially reduces the risk premium required by institutional capital.
This distinction matters because equity investors evaluate solar returns not only on yield but on risk-adjusted yield. A portfolio with 200 contracted rooftops across multiple European markets behaves fundamentally differently from a single 5 MW ground-mount project. The former offers granular diversification, shorter deployment timelines, and reduced grid dependency. As industry analysis from the IEA confirms, distributed generation assets can be commissioned in weeks rather than years, which accelerates time to revenue. This is a critical advantage when compared to how long it takes to build utility-scale solar farms in Europe, where connection queues in some markets stretch beyond three years.
Platforms like ENSOOL’s distributed solar platform are designed to address this structural gap – turning fragmented rooftop assets into portfolios that can be underwritten, operated, and scaled as institutional-grade infrastructure. When assets are standardised, contracted, and aggregated, the equity return profile shifts from project finance to infrastructure yield.
| Factor | Standalone Solar Project | Aggregated Solar Portfolio |
|---|---|---|
| Counterparty risk | Single offtaker | Diversified across dozens or hundreds of SMEs |
| Revenue visibility | Contract-dependent, binary renewal risk | Staggered contract maturities, smoothed cashflows |
| Deployment timeline | Months to years (permitting, grid connection) | Weeks per site, parallel deployment |
| Scalability | Limited by site-specific constraints | Repeatable process across geographies |
| Equity return profile | Project finance risk-return | Infrastructure-grade yield with compounding |
Forward Outlook: How Solar Assets Will Generate Returns for Equity Investors in 2025 and Beyond
Several structural forces are converging to strengthen the equity return profile of solar assets across Europe. According to Eurostat, non-household electricity prices remain structurally above historical baselines, even following the stabilisation after the 2022 energy crisis. This sustained price environment improves the economics of on-site solar generation and supports stronger PPA pricing for asset owners. At the same time, grid congestion is increasing the value of local, distributed generation that bypasses transmission bottlenecks.
For equity investors evaluating how a solar asset generates returns, the forward outlook is defined by compounding dynamics. As platforms aggregate more sites, operating costs decline per unit of capacity, contract negotiation leverage increases, and portfolio-level data improves underwriting precision. These are the mechanics of platform-driven value creation – not dissimilar from how infrastructure platforms in logistics or telecommunications compound value over time. Current European rooftop solar market insights confirm that deployment is accelerating precisely because the economic case has moved beyond policy dependency into structural demand.
The combination of contracted revenues, low operating costs, long asset lives, and portfolio diversification creates a return profile that is difficult to replicate in other infrastructure segments. For equity investors seeking inflation-linked, long-duration cashflows with minimal commodity exposure, distributed solar portfolios represent a compelling allocation opportunity.
Frequently Asked Questions About How Does a Solar Asset Generate Returns for Equity Investors
What is the typical equity return from a solar asset in Europe?
How does a solar asset generate returns for equity investors compared to wind?
What risks affect how solar assets generate returns for equity investors?
Why do institutional investors prefer aggregated solar portfolios over individual projects?
The question of how a solar asset generates returns for equity investors is ultimately a question about structure. The generation economics of rooftop solar are proven. What determines whether those economics translate into institutional-grade returns is how assets are aggregated, contracted, and managed over time. As Europe’s distributed solar market matures from fragmented installations into scaled portfolios, the equity opportunity shifts accordingly – from project-level speculation to infrastructure-grade compounding. ENSOOL is building the platform layer designed to enable that transition, turning thousands of individual rooftops into a coherent, investable asset class.