Realistic ROE Solar Infrastructure Funds Europe: 7 Facts
What Is a Realistic ROE for Solar Infrastructure Funds in Europe?
What is a realistic ROE for solar infrastructure funds in Europe? For most institutional-grade solar infrastructure funds operating across the continent, a realistic return on equity falls in the range of 6% to 12%, depending on asset structure, contract duration, geography, and whether the portfolio is utility-scale or distributed. Contracted assets with long-term PPAs and investment-grade counterparties tend to cluster at the lower end, offering stability and predictability. Distributed solar portfolios – particularly those aggregated across commercial and industrial rooftops – can push toward the higher end, reflecting both the operational complexity and the structural premium available in fragmented markets. Understanding what drives ROE for solar infrastructure funds in Europe requires looking beyond panel economics and into how assets are structured, aggregated, and financed.
What Drives ROE for Solar Infrastructure Funds in Europe Today
The return on equity that solar infrastructure funds in Europe can realistically achieve is shaped by several structural factors. Contract length is among the most significant. A fund holding assets under 15- to 25-year PPAs with creditworthy offtakers benefits from long-duration revenue visibility, which reduces risk but also compresses returns. Merchant exposure – where a portion of revenue is tied to wholesale electricity prices – introduces volatility but can meaningfully lift ROE when power prices remain elevated, as they have across much of Europe since 2022.
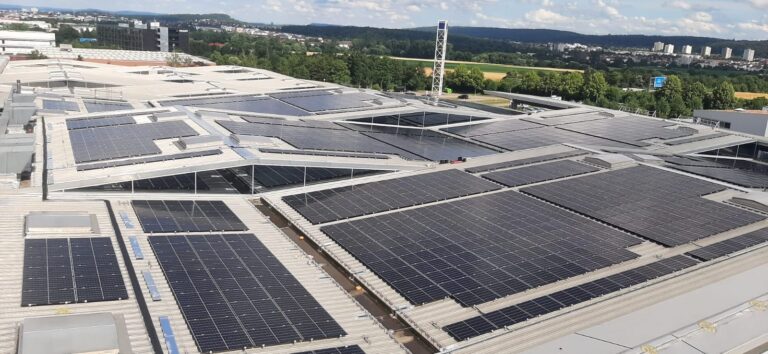
Geography also matters. Markets like Germany, the Netherlands, and Poland each present different regulatory environments, grid dynamics, and solar irradiance profiles. According to SolarPower Europe, the EU installed approximately 56 GW of new solar capacity in 2023, with distributed rooftop systems representing a growing share, particularly in these markets. For investors evaluating realistic ROE for solar infrastructure funds, the distinction between utility-scale and distributed assets is becoming increasingly important as the market matures. As explored in detail across distributed rooftop solar infrastructure in Europe, the aggregation of commercial rooftops into portfolios is creating a new category of infrastructure yield.
Leverage structure is another key variable. Most infrastructure funds deploy project-level debt at 60% to 80% loan-to-value ratios. In a higher interest rate environment, the cost of debt directly compresses equity returns unless offset by stronger revenue or lower deployment costs. Industry estimates suggest that the all-in cost of rooftop solar has continued to decline, which supports equity return profiles even as financing costs have risen.
Why ROE for Solar Infrastructure Funds Differs Between Utility-Scale and Distributed Models
A critical distinction when assessing realistic ROE for solar infrastructure funds in Europe is the difference between utility-scale and distributed solar portfolios. Utility-scale projects offer simplicity – single-site, high-capacity assets with standardised engineering. But they increasingly face grid connection delays that can stretch for years, as detailed in How Long to Build Utility-Scale Solar Farm in Europe: 5 Facts. These delays directly affect time-to-revenue, which erodes IRR and, by extension, ROE.
Distributed solar portfolios present a different profile. Each individual rooftop is smaller, but when aggregated through a platform model, the portfolio can offer diversified counterparty risk, faster deployment timelines, and behind-the-meter revenue advantages. The operational complexity is higher, but so is the structural return premium. For a deeper look at the dynamics shaping this segment, European Rooftop Solar Market: 7 Critical Insights Now provides current market intelligence on deployment trends and commercial adoption rates.
| Factor | Utility-Scale Solar Fund | Distributed Rooftop Solar Fund |
|---|---|---|
| Typical ROE range | 6% – 9% | 8% – 12% |
| Revenue model | Wholesale PPA or merchant | Behind-the-meter PPA with SME offtakers |
| Deployment timeline | 2 – 5 years (grid connection dependent) | Weeks to months per site |
| Counterparty diversification | Low (single or few offtakers) | High (hundreds of SME counterparties) |
| Grid dependency | High – subject to congestion queues | Low – behind-the-meter generation |
| Scalability model | Project-by-project development | Platform-driven aggregation |
| Operational complexity | Lower per site | Higher per site, lower at portfolio level |
Forward Outlook: Where ROE for Solar Infrastructure Funds in Europe Is Heading
Looking ahead, the realistic ROE for solar infrastructure funds in Europe will increasingly depend on asset structuring rather than generation economics alone. Panel costs have largely commoditised. What differentiates returns now is the ability to aggregate, contract, and manage assets at scale with long-term revenue visibility.
Several structural tailwinds support continued attractive equity returns in the distributed segment. According to Eurostat, non-household electricity prices across the EU remain above historical baselines, reinforcing the economic case for on-site solar generation. Grid congestion is increasing the relative value of distributed generation assets that bypass transmission bottlenecks. And institutional capital continues to search for contracted infrastructure yield in a market where traditional infrastructure assets are becoming scarcer and more competitive.
Platforms like ENSOOL’s distributed solar platform are designed around this thesis – that distributed rooftop solar, when aggregated into portfolios with standardised deployment and long-duration PPAs, can deliver infrastructure-grade returns. The transition from fragmented project development to scalable portfolio ownership is what unlocks the ROE premium in distributed solar. As this model matures across Europe, the distinction between project returns and platform returns will become a defining factor for fund performance.
Frequently Asked Questions About What Is a Realistic ROE for Solar Infrastructure Funds in Europe
What is a realistic ROE for solar infrastructure funds in Europe in 2025?
How does distributed solar ROE compare to utility-scale solar fund returns?
What factors most affect ROE for European solar infrastructure investors?
Can solar infrastructure funds in Europe maintain ROE above 10%?
The question of realistic ROE for solar infrastructure funds in Europe is ultimately a question about structure. The generation economics are well established. What separates infrastructure-grade returns from project-level returns is the ability to aggregate distributed assets into portfolios with contracted, long-duration cashflows. As the European rooftop solar market moves from fragmented deployment to scaled platform formation, the investors and operators who can bridge that gap will be the ones who define the next generation of infrastructure yield.